
Gaging For SPC: Now Even Simpler
George Schuetz, Mahr Inc.
To found out more about how gaging for statistical process control can become even simpler then read the article from Mahr Inc. by George Schuetz found at https://www.mahr.de/en-us/Services/Production-metrology/Know-how/Gaging-Tips/ along with several other tips and articles on Gaging.
Author’s note: This is an updated version of a column that originally ran in December 1992. I was surprised, (1) at how little updating was needed, and (2) that guys who keep asking me about this apparently didn’t pay attention the first time! — Geo
After all that has been written about Statistical Process Control (SPC) over the years, I am continually surprised at how often shop owners tell me they would like to do Data Collection for SPC, but they’re “just too small,” or they “can’t afford all that fancy equipment.” There seems to be a mistaken perception out there: 1) that SPC is a lot more complicated than it is, and 2) that you need expensive hardware and a sophisticated computerized system on‑line just to get into it.
This is unfortunate because small shops can often benefit the most from SPC and there really is no reason they should not. The simple fact is that you don’t need a big investment in hardware and you don’t need to be a statistical genius to do data collection for SPC. All you need, really, is an indicating gage, a pad, and a pencil to start. And today, even the pad and pencil can be eliminated because the chances of errors are so great. Data collection can easily be automated and integrated into your existing inspection process. So if you are one of those who is still hesitant about collecting data, try this easy-to-follow recipe for small shop SPC.
Before you start, you do have to understand a little bit about the process itself. This is not difficult. The basic principles of SPC were developed back in the ’30s — long before computers were invented — and have not really changed since…an X/R chart then is the same as an X/R chart now. Nor do you need to understand all the theory behind the process…just the basics of frequency distribution and charting will do for a start, and there are many guides to help do this.
Next, get the process in place. This involves three steps. First, look at the part you’re going to measure. What are its important dimensions and what part of the process controls them? This is what you want to measure and where you want to start the process. But keep it simple. Start with a single measurement until you get the feel for it.
Second, look at the gaging equipment you are going to use. Make sure you follow all the gaging basics we’ve talked about in this column and that you have the right gage for that type of measurement. Do you need the flexibility of a digital caliper, or do you have tighter tolerances that require variable gaging and digital indicators? You should also run a series of Gage Repeat and Reliability (GR&R) studies to make sure your measurements are as accurate as possible. Remember, whatever “analysis” you do can only be as accurate as the measurements you start with.
Now you’re ready to think about the data collection part. What you’re basically looking at is taking a few simple measurements, averaging them, and then recording the results. While this can seem simple, it is often the most daunting part of the process for the operator. Manual recording takes much effort on the part of the machinist or inspector, and is fraught with the potential for errors, like writing down the wrong number. A simpler, faster and way more accurate method is to transmit measurement data electronically. Today’s digital micrometers, calipers and indicators can transfer their measurement results wirelessly to the PCs already located at the workstation. Thus, there is no high cost barrier to begin the process of collecting data. With today’s wireless gaging, you can get going for the price of the gage.
The final step in setting up is to benchmark your machining process. You need to find out if your machine is capable of holding the tolerances or control limits you require. Your SPC guide can help you do this.
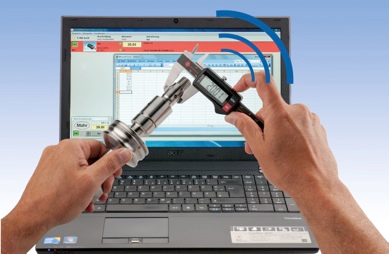
Now you’re ready to gather data. Simply, start feeding the data into the existing computer the operator is already using. Most everyone today is familiar with Excel® worksheets. Using wireless gaging, it’s easy to drop measurement data right into the spreadsheet. With this simple automation, the operator is not being asked to do any more work. They still measure the parts — only now they can watch their work being collected in the spreadsheet.
With a little creativity and the power of Excel®, much can be done with the collected data. This is often an eye opener to the machinist. He is able to see that there is a relationship between what he’s doing and what the spreadsheets show. He sees that his process does have variation, something which is not apparent to the naked eye. And with a few simple charts he can learn to predict how it changes and then be able to control it. He sees his wheel is wearing, for example, and knows when, and when not, to compensate. Charting empowers the operator, and that, ultimately, is what SPC is all about.
That’s it: simplified SPC for the small shop. Start small, take it one step at a time, and keep your operators involved. Remember, SPC is not a thing you buy, it’s a thing you do.
Using wireless gaging it’s easy to drop measurement data right into the spreadsheet. With this simple automation the operator is not being asked to do any more work. They still measure the parts — only now they can watch their work being collected in the spreadsheet.